 Flat 50% off on trading fees for the first 1500 early birds: Click here to join now & claim your reward!
The impact of Bitcoin’s low volatility on BTC prices
- Exciting news in the world of Bitcoin! The rollercoaster ride of volatility seems to be calming down.
- AxelAdlerJr, in a latest report, reveals that this calming effect has reached historical lows.
The Bitcoin [BTC] market is experiencing a period of low volatility, as discovered by the mysterious CryptoQuant analyst AxelAdlerJr in a fresh report.
In the report, AxelAdlerJr points out that two of BTC’s crucial volatility indicators have been on a downward trend recently, indicating a decrease in the likelihood of sudden price fluctuations.
The first indicator studied by the analyst was BTC’s Garman-Klass Realized Volatility, which tracks the historical volatility of BTC’s price. This metric uses the asset’s highs, lows, opening, and closing prices over a specific period to gauge its volatility during that timeframe.
AxelAdlerJr highlighted that BTC’s Garman-Klass Realized Volatility has plummeted to 20%. A low value on this metric signifies a reduction in the asset’s price volatility.
Historical data from the indicator shows that previous instances of such low volatility led to significant price movements in BTC over the past six years.
Additionally, the analyst looked at BTC’s Volatility Index using a 30-day small moving average (SMA). This index measures the extent of price fluctuations in BTC over a specific period.
Mirroring the Garman-Klass Realized Volatility, BTC’s Volatility Index has also seen a decline, confirming the overall low volatility in the top coin’s market.
According to the analyst at CryptoQuant, the index has dropped to incredibly low levels, a rare occurrence that only happened four times in the past six years.
Minimal Price Swings in BTC
AMBCrypto’s analysis of BTC’s Bollinger Bands and Average True Range echoes the findings of the analyst.
Observations from BTC’s Bollinger Bands indicate a narrowing gap between the upper and lower bands, typically seen during periods of reduced price fluctuations.
The declining Average True Range (ATR) in BTC further confirms this trend. This indicator calculates the average range between high and low prices over a specified number of periods to measure market volatility.
Discover Bitcoin’s [BTC] Future Price Prediction for 2024-2025
A decrease in the ATR suggests lower market volatility, indicating that the asset’s price is moving within a specific range. Currently at 2138.35, BTC’s ATR has fallen by 44% since April 19th.
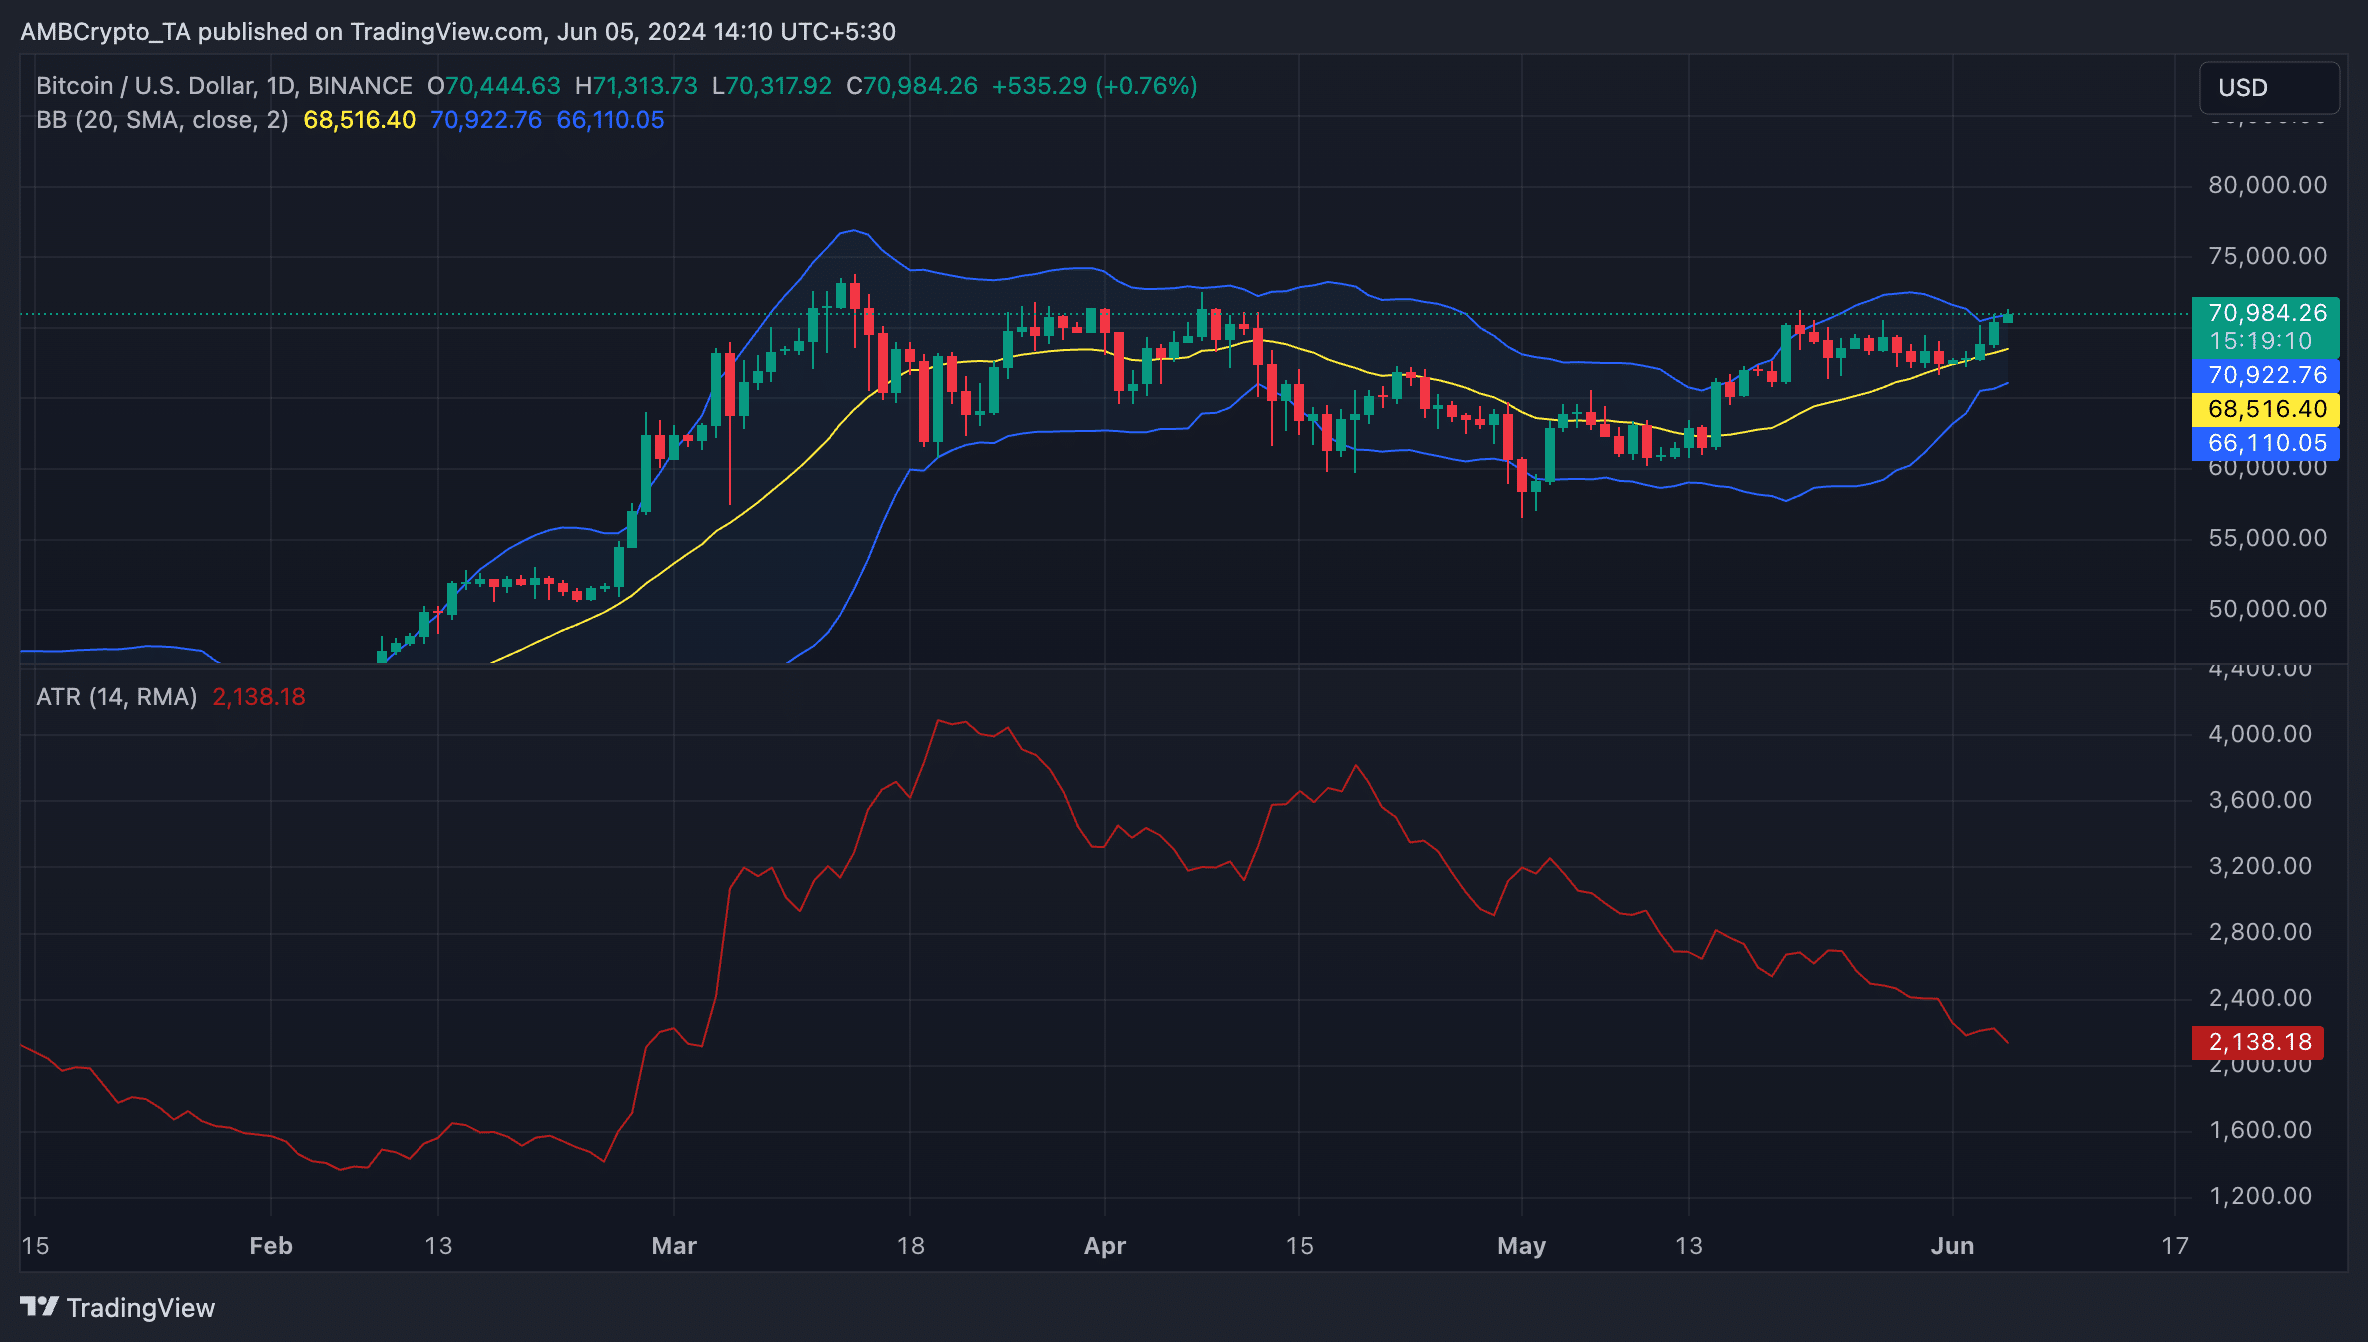
Source: BTC/USDT on TradingView
In AxelAdlerJr’s opinion, the current low volatility in the BTC market is a positive development.
“With the market staying bullish and a potential surge in price movements after this period of calm, it’s likely that a new bullish trend is on the horizon,” the analyst stated.


